
Most people struggle with information overload, unclear priorities, and mental clutter. That’s why why visual thinking improves decision‑making has become a major topic in psychology, leadership, and cognitive science. Visual thinking helps individuals and leaders cut through noise, see patterns faster, and make clearer choices with confidence.
Decision‑Makership™ puts visual thinking at the center because it’s the fastest way to turn complexity into clarity.
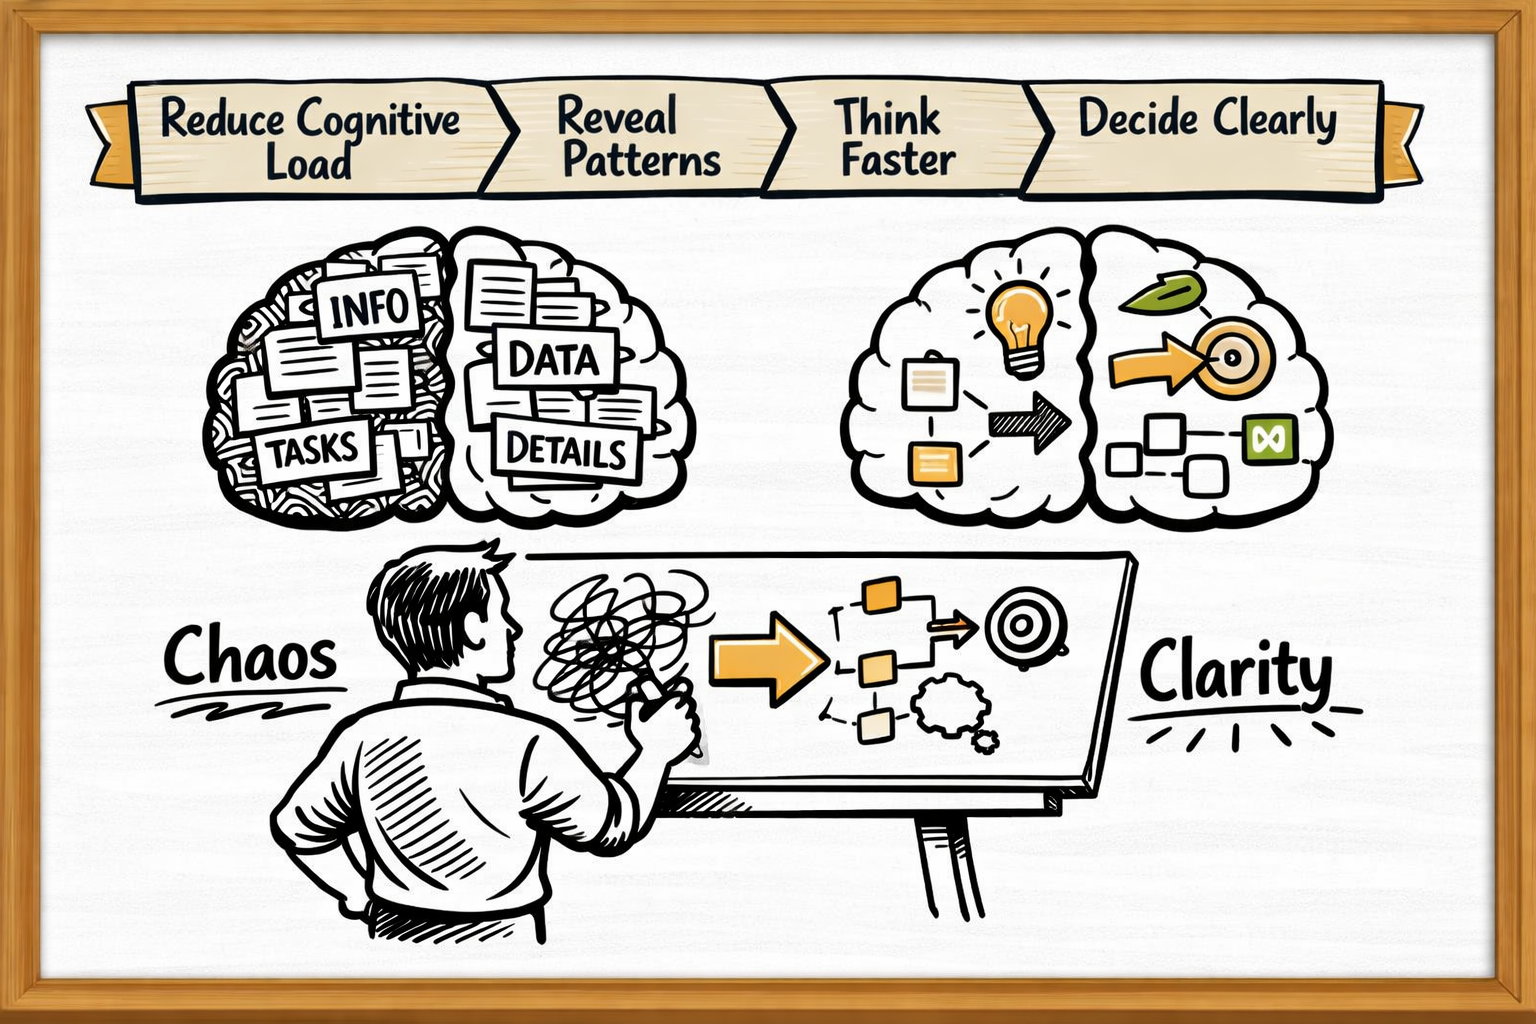
1. Visual Thinking Reduces Cognitive Load
The human brain can identify an image in as little as 13 milliseconds. When information is visual, the mind doesn’t have to work as hard to interpret it.
This is why maps, diagrams, and sketchnotes instantly make sense — they reduce mental strain.
Research on visual cognition and decision-making shows that visuals help people understand complex information more quickly and accurately. Visuals reduce cognitive load and improve comprehension compared to data presented in tables.
2. Visuals Reveal Patterns That Words Hide
Text is linear. Visuals are spatial. That difference matters. Information visualization significantly improves response time (decision efficiency) by directing your eyes to salient (highly noticeable) patterns rather than raw data.
When you sketch a problem, patterns emerge:
- What’s connected
- What’s missing
- What’s causing friction
- What’s influencing what
This is why design thinking relies heavily on diagrams and mapping. Research on design thinking and problem-solving shows that visual tools help individuals and teams uncover insights faster.
3. Visual Thinking Helps You Make Faster, Clearer Decisions
When you draw a decision, you externalize your thinking. This creates:
- Distance
- Objectivity
- Clarity
- Focus
It also reduces emotional bias — because once a problem is on paper, it becomes easier to evaluate. Studies on visual decision-making frameworks show that visuals help people make faster, more confident choices.
4. Visuals Improve Memory and Recall (Backed by Real Science)
Studies show visuals improve cognitive functions. You may have heard the popular claim that we remember exactly “10% of what we read vs. 65% of what we see.” This is an oversimplification however research on presentation modality and the Picture Superiority Effect confirms that visuals are powerful.
Studies show that:
- The brain processes visual information much faster than text
- Visuals activate memory‑related brain regions more effectively
- People consistently recall images better than words
This is why visual thinking is so powerful: it aligns with how the brain naturally encodes, stores, and retrieves information.
5. Visual Thinking Helps Individuals AND Leaders
This article isn’t just for executives — it’s for anyone who wants to think more clearly.
Individuals benefit because visuals help them:
- Organize thoughts
- Reduce overwhelm
- Prioritize tasks
- Understand emotions
- Make personal decisions with clarity
Leaders benefit because visuals help them:
- Communicate direction
- Align teams
- Reduce confusion
- Speed up execution
- Build shared understanding
Visual thinking is the universal language of clarity.
6. Best Practices: Visual Thinking and Design Thinking
The most effective decision‑makers don’t just think — they see their thinking. Visual thinking transforms abstract ideas into clear, actionable maps. Design thinking adds structure, empathy, and iteration to those visuals, turning insight into innovation.
Together, they form the backbone of Decision‑Makership™: a disciplined approach to making sense of complexity and acting with clarity. These practices help individuals and leaders alike see patterns, test ideas, and make decisions faster — vital skills for any profession, sector, or industry.
Essential Visual Thinking Tools
These tools help individuals and teams turn complexity into clarity:
- Mind Maps — Organize ideas visually to reveal relationships and priorities.
- Concept Maps — Show how concepts connect and influence each other.
- Sketchnotes — Combine words and visuals to capture ideas quickly and memorably.
- Canvases — Frameworks like the Business Model Canvas or Decision Canvas that structure thinking.
- Flowcharts — Map processes and decisions step‑by‑step for clarity.
- Visual Alphabets — Simple shapes and icons that form a universal visual language.
- Storyboards — Sequence events or decisions to visualize cause and effect.
- Sand‑Table Diagrams — Military‑inspired layouts for visualizing terrain, movement, and strategy.
- Empathy Maps — Capture user or stakeholder perspectives visually to guide design thinking.
- Decision Trees — Visualize options, risks, and outcomes to make complex choices manageable.
Each of these tools helps you see what you think, simplify what you know, and decide what matters — the essence of Decision‑Makership™.
7. Why Decision‑Makership™ Focuses So Heavily on Visuals
The Decision‑Makership™ framework uses visual thinking because:
- It works under pressure
- It works across cultures
- It works for individuals and teams
- It works in any profession, the military, business, and personal life
- It makes decision‑making repeatable instead of emotional
Visuals turn decision‑making into a discipline — not a guessing game.
This is why your book, your consulting, and your sketchnotes resonate: People are desperate for clarity, and visuals deliver it instantly.
The Bottom Line
Understanding why visual thinking improves decision‑making is essential for anyone who wants to think more clearly, act more confidently, and reduce overwhelm. Visual thinking is not a “nice to have” — it’s a cognitive advantage.
Decision‑Makership™ uses visuals because they help people see what matters, cut through noise, and make decisions they trust.